Carmel Software has been developing mobile apps for 10 years. In fact, we were the first to release HVAC-specific mobile apps for Apple iOS, and we currently have 200,000+ apps downloaded by users world-wide.
What makes mobile apps so different from desktop apps is the ability for small companies like ours to reach tens of thousands of users world-wide. Downloading an app from your smartphone is so easy, simple, and inexpensive, that it enables a company like ours to reach out to so many more users compared to our desktop software.
Another amazing thing about mobile apps is the ability to anonymously (and I stress ANONYMOUSLY) track where and how users actually user our apps out in the field. This provides incredibly valuable feedback to us regarding how our apps are actually used in real time. Let’s look at some examples below.
HVAC PT Chart
The HVAC PT Chart app is a free iOS app that allows HVAC technicians to quickly perform pressure-temperature lookups for over 100 different types of refrigerants. As a technician is measuring refrigerant pressure or temperature using the pressure-temperature gauge, they can use our app to confirm that the pressure-temperature combinations are correct. Because this app is free, the number of downloads is exponentially greater than even our $0.99 apps. Free really does sell.
Tens of thousands of technicians have downloaded this app, so it really helps create critical mass in terms of tracking how this app is used and how and where technicians work.
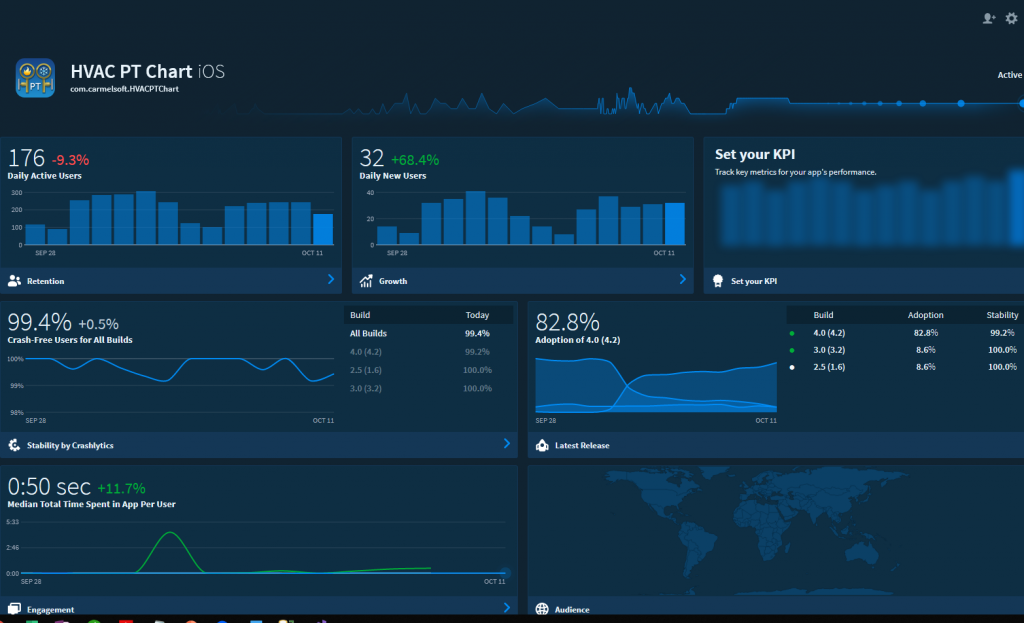
The image above captures a snapshot of how many users have used the PT Chart app on a typical Friday by late morning. This dashboard also captures other interesting information including:
User locations
How long users have used the app (interestingly, most users use this app for less than 1 minute at a time)
Whether the app has crashed or not
What version of the app users are using
What parts and features of the app are users taking advantage of
The image below shows geographical usage since the beginning of the year. As you can see, the app is pretty much used world-wide (the light and dark blue signifies countries using the app). The dark blue areas indicate the highest concentration of users.
Another screen shows the following additional information:
The left-hand side shows what percentage of users are using the app on iPhones versus iPads. The right-hand side shows what percentage of users are using the app on different iOS versions.
Now, there question is: Is any of this data useful and actionable?
We can see that the majority of users use the app on the iPhone, so this tells us to concentrate most of our efforts on improving the iPhone interface. Also, knowing that 100s of HVAC technicians use this app each day tells us that this app is quite useful and a good candidate for some in-app advertising (more on this in a future blog post).
Also, it’s quite useful to know that users use this app for less than 1 minute on average. This allows us to better tailor certain features to accommodate speedy usage of the app. For example, immediately when users open the app, they are able to select a refrigerant type, select the temperature or pressure and observe the corresponding values.
HVAC Equipment Locator
The HVAC Equipment Locator is a mobile application for Apple iOS and Android that lets users track, share, and customize HVAC equipment nameplate and maintenance data:
TRACK all equipment location, nameplate, and maintenance data along with photos and spec sheets.
SHARE all of this data with other authorized users.
CUSTOMIZE the app input screens so users can store and view the exact data about building, equipment, or maintenance events. All equipment data and user access using the Equipment Locator Cloud website.
The following is an interactive Google map that plots a subset (1000s) of all of the approximate locations of HVAC equipment that are currently being tracked and serviced by the HVAC Equipment Locator app:
Not only are we tracking usage of the Locator app, itself, but also tracking the GPS coordinates of all of the equipment that users are storing in the cloud. Once we receive enough equipment information, we can start to see trends of where different makes and models of equipment are geographically located, and also what types and where HVAC maintenance is being performed.
Overview
We have developed a number of equipment selection software tools over the years. While this type of software is not the sexiest type of software out there and its user-base is quite small compared to games or word processors, we feel that this type of software is quite interesting to develop. I’d like to share a bit about our experiences with developing 2 different types of equipment software selection tools for several large HVAC manufacturing companies.
Definition
What is equipment selection software exactly? It is a computerized or digital tool that allows users to properly choose the correct HVAC manufacturer’s model equipment based upon a wide variety of input and/or output parameters. Depending upon the type of equipment, the parameters can vary greatly. For example, HVAC humidification equipment requires input parameters such as outdoor weather conditions, elevation, indoor air temperature and humidity, and required outlet air conditions.
Users of this type of software include HVAC engineers, manufacturers representatives, and manufacturer salespeople. These tools can be web, tablet, or desktop based software applications.
Mitsubishi Electric
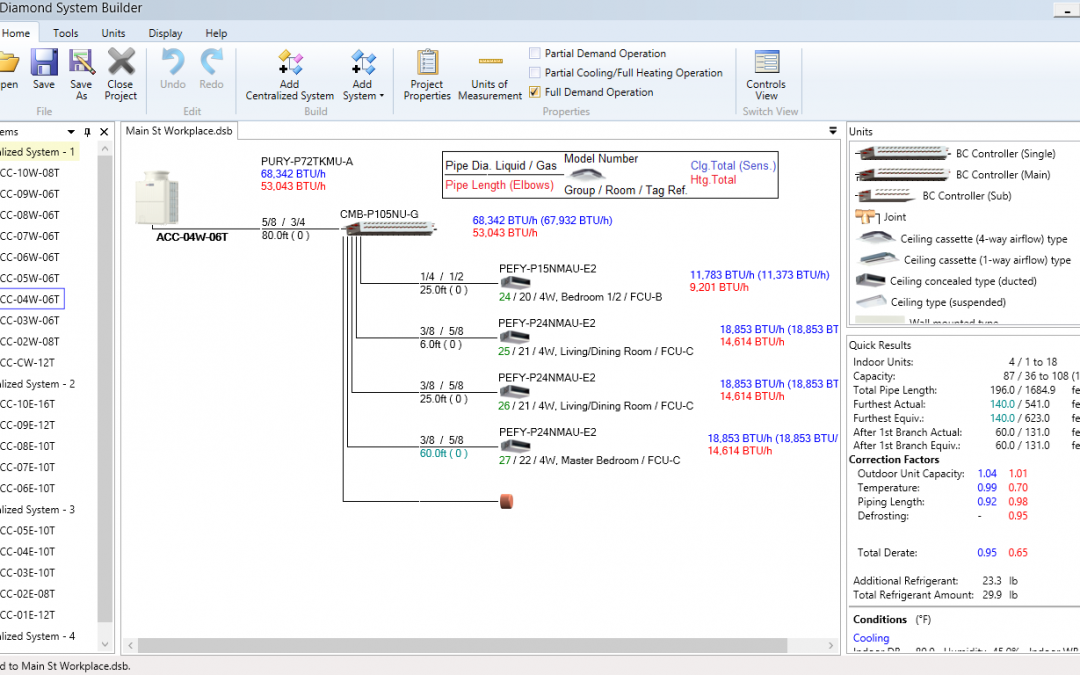
We were hired by Mitsubishi Electric (ME) of America to develop an equipment selection desktop software tool for their line of VRF (variable refrigerant flow) HVAC equipment. They insisted that the tool have a graphically intensive user interface with lots of drag-and-drop functionality. The software tool would allow users to lay out a schematic of the VRF system including the outdoor unit, indoor units, connectors, pipes, and other components. The tool would be strictly rule-based so it would inform the user as to whether a certain length of pipe was allowed or if a certain model outdoor unit could be paired with a specific indoor unit. The types of outputs were numerous including PDF reports, AutoCAD schematics, spreadsheet outputs, XML, and even proprietary file format output to a Mitsubishi controller.
Other functionality included the ability to dynamically update and add new equipment model information, localization include language and regional models for different areas of the world, and ability to layout controls wiring.
This projected took about 3 years to fully develop and finally deploy to end users including Mitsubishi engineers, resellers, and salespeople.
Some takeaways from this project:
1. It took much longer to develop than originally planned (no surprise, here). Between changing requirements and long approval waiting periods, the timeline almost tripled.
2. Localizing software tools is a very complex endeavor. It not only involves translation files for one or more languages, but it also involves filtering equipment selections depending upon the region of the world. Also, numerical values must be displayed in English or Metric units depending upon the region.
3. Integrating with popular third-party software tools such as AutoCAD is a never ending process since there are so many versions of AutoCAD that it is impossible to universally integrate with all of the versions. Therefore, a number of users who have incompatible versions of the tool are not able to utilize the functionality.
Advantix Systems
Advantix Systems is an HVAC manufacturer of dehumidification equipment. They have a patented, liquid desiccant technology that both cools and dehumidifies simultaneously, eliminating the need to overcool the air to control humidity. It’s actually quite ingenious, and the image below shows how this works:
This image courtesy of Advantix Systems: http://www.advantixsystems.com/how_it_works_more_efficient.php
As you can see from the psychrometric chart, dehumidification occurs without having to ride the saturation curve (green versus purple). This is an amazing engineering accomplishment, since now there is no need to waste energy on reheating the temperature from the saturation curve to the required dehumidification point.
Advantix Systems hired Carmel Software to develop a web-based equipment selection software tool that would allow reps and engineers to quickly select and price equipment based upon required conditions. Features included:
Creating a quick rating of a product (or set of products) given inlet conditions (airflow, temperature, humidity) and an Advantix model number. It would display product performances (decrease in temperature and moisture removal, outlet conditions, energy removed (total and latent).
Creating a quick selection of equipment under specific conditions (temperature, humidity, airflow, desired outlet temperature and humidity or desired temperature decrease and moisture removal) and allow the user to select from 1 or more models that satisfy the required outlet conditions
Creating guided selections that ask the user a number of leading questions that tell the software which models are most appropriate
Providing relevant PDF submittal documentation for selected equipment
Ability to manage equipment performance, documentation and options by either editing or adding new equipment.
Key Takeaways
This was an extremely complicated project due to a number of factors including:
It was extremely calculation intensive. Not only were there complex psychrometric calculations, but complicated logic to select the most optimal equipment either by efficiency or cost standards. In other words, we weren’t done after the basic psych calcs. There was a lot more to do after calculating the outlet conditions including develop complex logic to iterate through 100s of scenarios to determine the optimal equipment configuration.
There were lots of reporting requirements requested by the client. Not only were we dynamically generating PDF submittals, but also drawing elevation-specific psychrometric charts with all process points and lines.
As is a common theme here and with almost all specialty software development companies, this project took far longer than originally planned by either parties. This was mainly due to changing requirements and complex logic that far exceeded our expectations.
Carmelsoft have been accepted to the Autodesk Cloud Accelerator program from March 14 to 18, 2016 in San Francisco, CA at Autodesk’s 1 Market Street facility. During the Accelerator, we will be working intensively on a specific project to integrate our mobile apps with the Autodesk Forge platform with the help, support and training of the Autodesk Cloud Engineering team. By the end of the week, we hope to have a working
prototype in-hand.
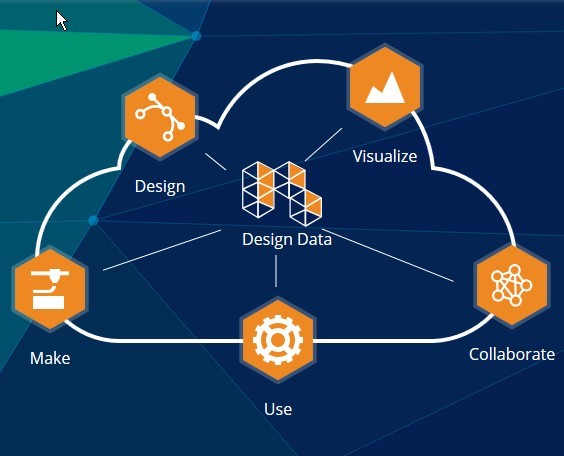
The Autodesk Forge platform is a set of Autodesk Cloud Services, APIs and SDKs for developers to create data, apps, and services that integrate with some of Autodesk’s cloud offerings. The Forge platform includes tools that:
Visualize: Interactively visualize data, create photo-real renderings and generate 3D models from your apps.
Collaberate: Application APIs for project and file access. SDKs to extend Autodesk Cloud Services with collaboration workflows.
Make: Turn designs into physical reality.
Use: Connect, analyze, control, and manage remote products, things, and assets.
The following is a list of Autodesk’s cloud APIs:
BIM 360 – Collaborative construction management softwareBIM 360™ construction management software enables almost anytime, anywhere access to project data throughout the building construction lifecycle.
BIM 360 Glue – BIM ManagementBIM 360™ Field is field management software for 2D and 3D environments that combines mobile technologies at the construction site with cloud-based collaboration and reporting.
Recap 360 – Reality capture and 3D scanning software Infraworks 360 – Preliminary engineering with data-rich 3D models
Fusion 360 – A new approach to industrial and mechanical 3D design
View & Data Cloud Services – Integrated viewing, search and data
AutoCAD I/O – For developers who want to process DWG files at cloud scale.
We will be taking advantage of the View and Data API. This API allows users to create custom web applications that enable customers to visualize and interact with 2D and 3D design data in a web browser or on a mobile device. The API supports over 60 file formats to bring detailed, high-fidelity visualizations of models. We will be integrating our HVAC ResLoad-J and Equipment Locator apps with the View and Data API so users can view building CAD drawings within these apps so as to easily extract geometric information. We’ll discuss more in future blog posts.