Carmel Software has been developing mobile apps for 10 years. In fact, we were the first to release HVAC-specific mobile apps for Apple iOS, and we currently have 200,000+ apps downloaded by users world-wide.
What makes mobile apps so different from desktop apps is the ability for small companies like ours to reach tens of thousands of users world-wide. Downloading an app from your smartphone is so easy, simple, and inexpensive, that it enables a company like ours to reach out to so many more users compared to our desktop software.
Another amazing thing about mobile apps is the ability to anonymously (and I stress ANONYMOUSLY) track where and how users actually user our apps out in the field. This provides incredibly valuable feedback to us regarding how our apps are actually used in real time. Let’s look at some examples below.
HVAC PT Chart
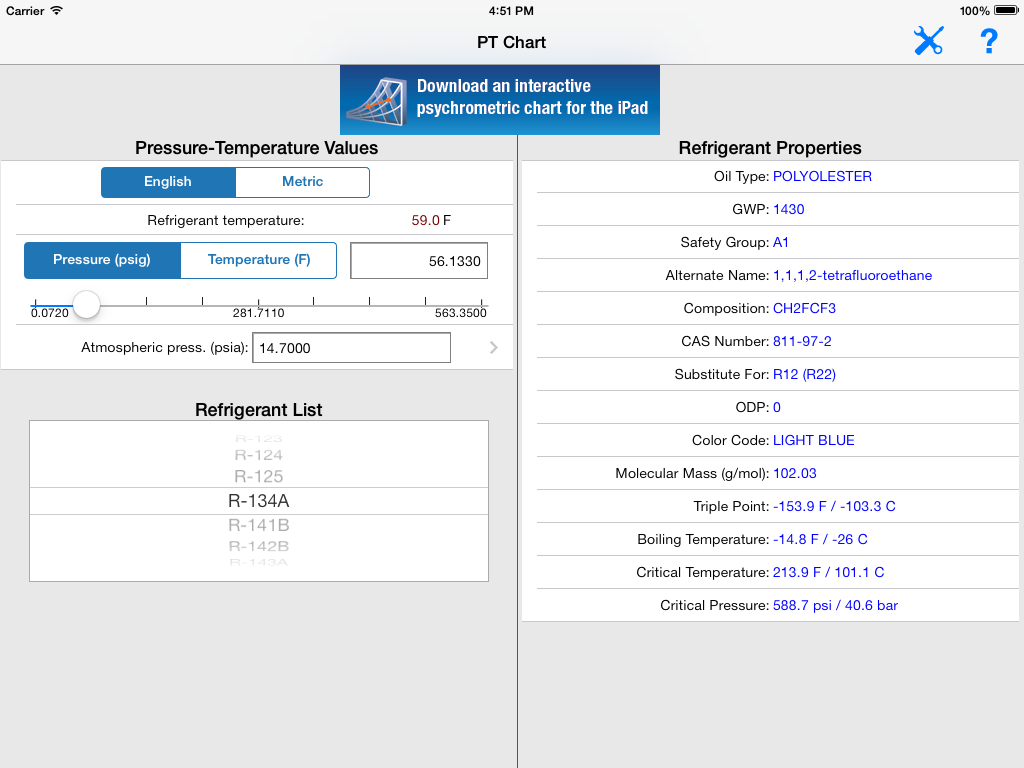
The HVAC PT Chart app is a free iOS app that allows HVAC technicians to quickly perform pressure-temperature lookups for over 100 different types of refrigerants. As a technician is measuring refrigerant pressure or temperature using the pressure-temperature gauge, they can use our app to confirm that the pressure-temperature combinations are correct. Because this app is free, the number of downloads is exponentially greater than even our $0.99 apps. Free really does sell.
Tens of thousands of technicians have downloaded this app, so it really helps create critical mass in terms of tracking how this app is used and how and where technicians work.
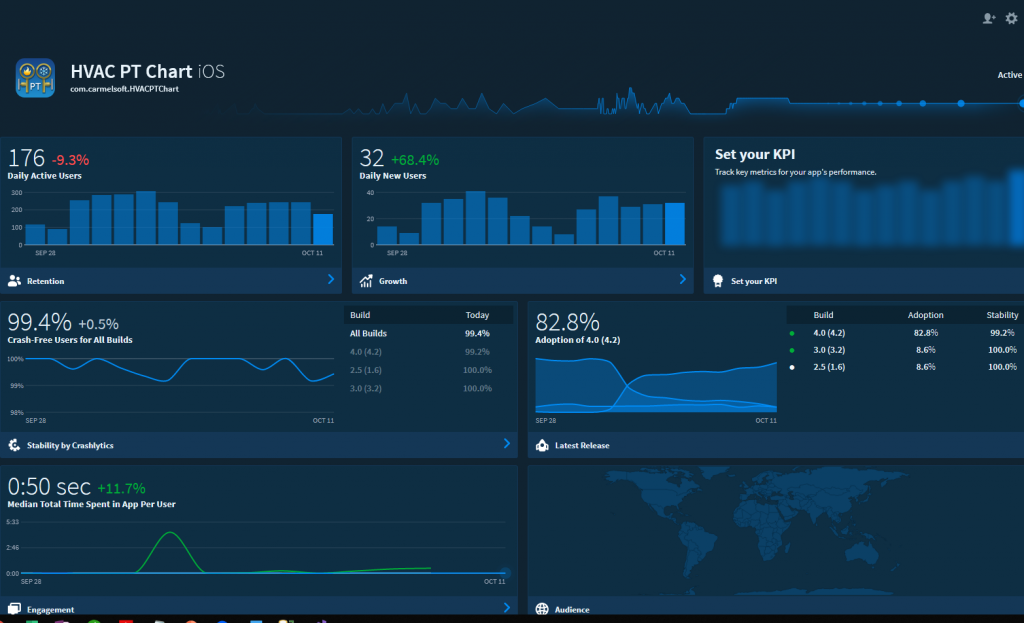
The image above captures a snapshot of how many users have used the PT Chart app on a typical Friday by late morning. This dashboard also captures other interesting information including:
- User locations
- How long users have used the app (interestingly, most users use this app for less than 1 minute at a time)
- Whether the app has crashed or not
- What version of the app users are using
- What parts and features of the app are users taking advantage of
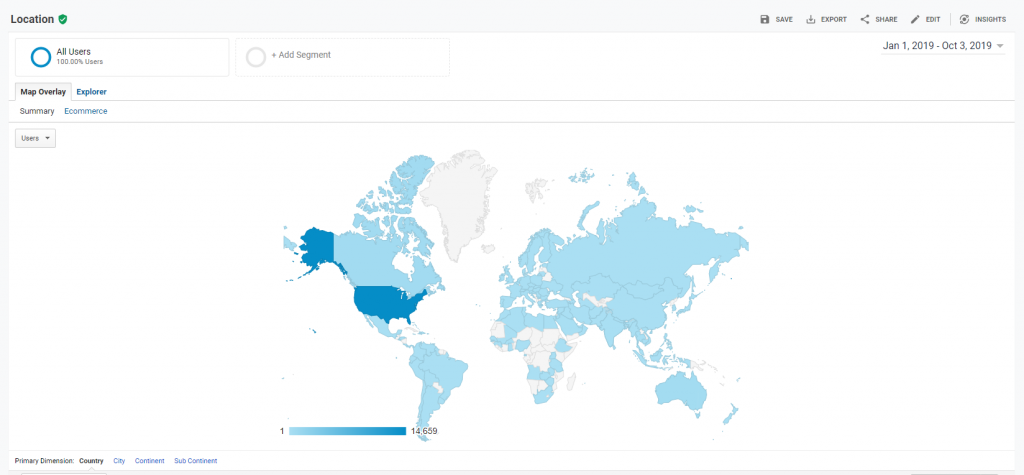
The image below shows geographical usage since the beginning of the year. As you can see, the app is pretty much used world-wide (the light and dark blue signifies countries using the app). The dark blue areas indicate the highest concentration of users.
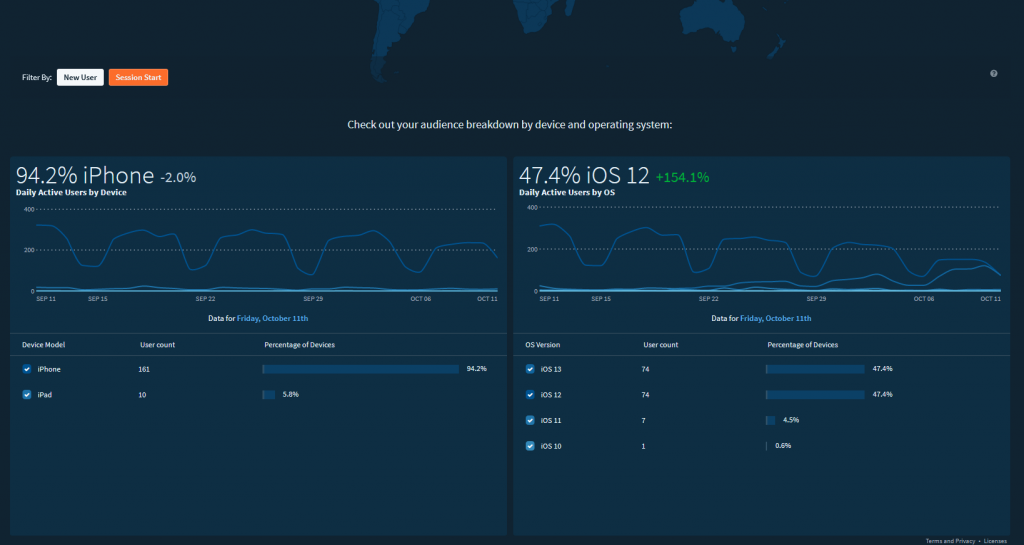
Another screen shows the following additional information:
The left-hand side shows what percentage of users are using the app on iPhones versus iPads. The right-hand side shows what percentage of users are using the app on different iOS versions.
Now, there question is: Is any of this data useful and actionable?
We can see that the majority of users use the app on the iPhone, so this tells us to concentrate most of our efforts on improving the iPhone interface. Also, knowing that 100s of HVAC technicians use this app each day tells us that this app is quite useful and a good candidate for some in-app advertising (more on this in a future blog post).
Also, it’s quite useful to know that users use this app for less than 1 minute on average. This allows us to better tailor certain features to accommodate speedy usage of the app. For example, immediately when users open the app, they are able to select a refrigerant type, select the temperature or pressure and observe the corresponding values.
HVAC Equipment Locator
The HVAC Equipment Locator is a mobile application for Apple iOS and Android that lets users track, share, and customize HVAC equipment nameplate and maintenance data:
- TRACK all equipment location, nameplate, and maintenance data along with photos and spec sheets.
- SHARE all of this data with other authorized users.
- CUSTOMIZE the app input screens so users can store and view the exact data about building, equipment, or maintenance events. All equipment data and user access using the Equipment Locator Cloud website.
The following is an interactive Google map that plots a subset (1000s) of all of the approximate locations of HVAC equipment that are currently being tracked and serviced by the HVAC Equipment Locator app:
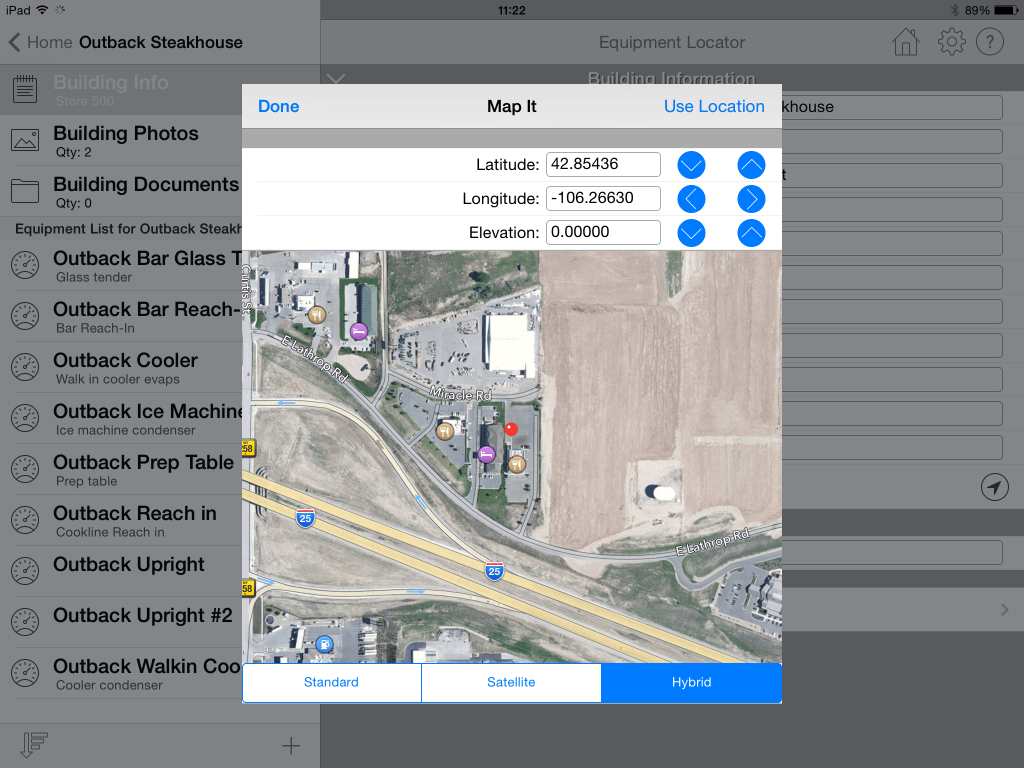
Not only are we tracking usage of the Locator app, itself, but also tracking the GPS coordinates of all of the equipment that users are storing in the cloud. Once we receive enough equipment information, we can start to see trends of where different makes and models of equipment are geographically located, and also what types and where HVAC maintenance is being performed.

