Carmel Software has recently received funding from the U.S. Department of Energy’s Building Technology Office (BTO) to develop a software tool that helps disparate software tools in the building energy audit space to communicate with one another, all in the name of reducing building energy usage. Remember, buildings use 40% of all energy in the United States, so this is a HUGE problem to solve.
The BTO released a Funding Opportunity Announcement (FOA), or a request for proposal in government-speak, to expand the number of third-party software tools that can import data from DOE’s Asset Score Audit Template (https://buildingenergyscore.energy.gov/ ) and the accompanying data format that it supports: BuildingSync XML (https://buildingsync.net/ ).
Energy Audit
First, what is a building energy audit? The purpose of an energy audit is to determine where, when, why and how energy is used in a facility, and to identify opportunities to improve efficiency. Energy auditing services are offered by energy services companies, energy consultants and engineering firms. The energy auditor leads the audit process but works closely with building owners, staff and other key participants throughout to ensure accuracy of data collection and appropriateness of energy efficiency recommendation. The audit typically begins with a review of historical and current utility data and benchmarking of the building’s energy use against similar buildings. This sets the stage for an onsite inspection of the physical building. The main outcome of an energy audit is a list of recommended energy efficiency measures (EEMs), their associated energy savings potential, and an assessment of whether EEM installation costs are a good financial investment.
There are 3 levels of energy audits according to ASHRAE:
ASHRAE Energy Audit Levels
Level I: Site Assessment or Preliminary Audits identify no-cost and low-cost energy saving opportunities, and a general view of potential capital improvements. Activities include an assessment of energy bills and a brief site inspection of your building. Level II: Energy Survey and Engineering Analysis Audits identify no-cost and low-cost opportunities, and also provide EEM recommendations in line with your financial plans and potential capital-intensive energy savings opportunities. Level II audits include an in-depth analysis of energy costs, energy usage and building characteristics and a more refined survey of how energy is used in your building. Level III: Detailed Analysis of Capital-Intensive Modification Audits (sometimes referred to as an “investment grade” audit) provide solid recommendations and financial analysis for major capital investments. In addition to Level I and Level II activities, Level III audits include monitoring, data collection and engineering analysis.
Software Tools We are Working With
Let me explain what some of the tools we are working with:
Asset Score is a national standardized web-based software tool that can be used to assess the physical and structural energy efficiency and identify retrofit potentials of commercial buildings using whole-building simulation. The Audit Template tool is a subset of Asset Score and is used to create a standard building energy audit report and submit to selected jurisdictions to comply with local ordinances, such as New York City’s LL87 or San Francisco’s BRICK.
DOE Asset Score Audit Template Tool
BuildingSync® is a common XML schema for energy audit data that can be utilized by different software and databases involved in the energy audit process. It allows data to be more easily aggregated, compared, and exchanged between different databases and software tools. This streamlines the energy audit process, improving the value of the data, minimizing duplication of effort for subsequent audits, and facilitating achievement of greater energy efficiency. BuildingSync can be exported from Audit Template so all information in an Audit Template project can be used externally by another software tool.
BuildingSync was developed to address the lack of an industry-standard collection format for energy audit data. Standardizing energy audit data can help energy auditors, software providers, building owners, utilities, and other entities by maximizing the value that can be obtained from each set of data – value obtained through collaboration, comparison, and reuse.
BuildingSync Use Case Selection Tool
ASHRAE Building EQ (see blog post here about ASHRAE Building EQ) is a web-based portal that provides a quick energy analysis that benchmarks a building’s energy performance. Building EQ assists in the preparation of an ASHRAE Level 1 Energy Audit to identify means to improve a building’s energy performance including low-cost, no-cost energy efficiency measures and an Indoor Environmental Quality (IEQ) survey with recorded measurements to provide additional information to assess a building’s performance.
ASHRAE Building EQ Software Portal
The Problem and Solution
Currently, the number of software tools that import Asset Score Audit Template data and BuildingSync is limited. The whole purpose of Asset Score Audit Template is to store energy efficiency data about a commercial building. However, this data is useless if it cannot easily be consumed by other related software tools that can perform building energy benchmark tests, building energy modeling, and other types of building analysis. The term used to describe how one software tool communicates with another is: interoperability.
Unfortunately, developing interoperability integration tools in existing building analysis software is a tedious and time-consuming process. Therefore, it discourages software developers from creating functionality such as those that import BuildingSync.
For Phase I of this DOE SBIR project, we proposed developing a web-based software tool (called Schema Server) that will completely streamline the flow of information from Asset Score Audit Template into third-party software tools such as ASHRAE Building EQ, so that all the user has to do is press one button on the producing or consuming software tool, and the software will perform quick data checks and validation and then seamlessly transfer data to the consuming tool, thereby eliminating the user having to manual enter the data. Phase I will focus solely on the workflow from Asset Score Audit Template to ASHRAE Building EQ. Once it is proven that this workflow can be streamlined, future phases will focus on other software tools. Phase I will also focus on making it easier for a third-party software developer to program BuildingSync import functionality into their building analysis software tool.
Benefits
Designing energy efficient buildings is of utmost importance today due to a wide variety of factors including limited fossil fuel resources, pollution, global climate change, federal and state laws, high energy costs, and a host of other reasons. Buildings use 40% of all energy and a whopping 75% of electricity. If society is going to rely less on fossil fuels, we need to design more energy efficient buildings for both new and existing construction. The first step in designing more energy efficient buildings occurs during the initial design phase which involves running building energy simulation and analysis software that will predict yearly building energy usage. Improving the interoperability workflows discussed above will benefit the following stakeholders:
Energy modelers: Give them more incentive to use various software tools to design energy efficient buildings since it will be an easier and more seamless process to enter the same data in more than one BIM authoring and building analysis or benchmarking software tool.
Software developers: Gives them more incentive to integrate interoperability functionality into their tools if there is an easier and less expensive way to do it.
Building owners: By designing more energy efficient buildings, it will save building owners a significant amount of money in utility and energy costs over the lifetime of the building.
Society as a whole: Whatever people’s political beliefs, there is no arguing that our fossil fuel supplies are finite, we are polluting the earth, and adverse climate changes are occurring all over the world including in our own backyard of California with unprecedented wildfires. Designing energy efficient buildings is just one step toward reducing our reliance of fossil fuels and cleaning the air for future generations.
During the downtime due to the pandemic-inspired shelter-in-place in California, I’ve decided to learn some new technologies and concepts related to software design. This has been my first foray into online learning using one of the e-learning platforms. In this case, I signed up for Udacity (https://www.udacity.com).
So far, I’ve been quite impressed. Of course, it does not perfectly substitute live classroom instruction, but it is still quite effective, plus I can skip to the good parts. The course I signed up for is titled “Artificial Intelligence and Python”.
While I’ve programmed scripts with Python before, I never knew that it had some many math and statistic-intensive libraries. Hence, it’s a great language for developing AI-related software since AI is all about statistics: predicting future events based upon historical information.
While the basics of Python programming is not that interesting, the libraries and tools associated with Python are fascinating and actually lots of fun to work with. This blog post will talk a bit about those libraries and also how they apply to AI. As of mid-April 2020, I have not finished the course yet, so emphasis is on the Python libraries used for AI, but not quite AI, itself.
NumPy
NumPy is a library for Python. It is short for “Numerical Python”, and it includes a large amount of functionality related to multi-dimensional arrays and matrices in addition to many mathematical functions. Users can create arrays from Python dictionaries, and then manipulate the arrays in many different ways including reshaping arrays, adding arrays, multiplying arrays, and much much more.
Here’s an example of how a simple numpy array works in Python:
Line 1 imports the numpy library and renames it. Line 2 defines a single row array with values from 0 to 9. Line 3 prints the array and Line 4 displays it.
Line 5 executes the “reshape” function that changes the shape of the array from a single row to a 2×5 array as seen in Line 7. Other functions allow you to insert rows in an array:
8. x = np.insert(x, 1, [10,11,12,13,14], axis=0)
The above “insert” statement inserts a new row at row 1 (row numbers start at 0). The numbers it inserts are: 10,11,12,13,14. The “axis” tells whether to insert a row (0) or column (1).
You can also perform mathematics on 2 arrays including addition, subtraction, multiplication, and division. For example:
x = [[0,1,2,3,4] [5,6,7,8,9]]
y = [[6,3,2,8,7] [1,6,7,3,10]]
print(x + y) = [[6,4,4,11,11] [6,12,14,11,19]]
The above “x” adds each of the elements from each row and column and creates the corresponding matrix with the added values. You can also do the same with the other mathematical functions.
There are many functions associated with numpy that can be found in lots of online documentation.
Pandas
Pandas is another Python library that deals with data analysis and manipulation. It takes the numpy arrays one step further and allow the creation of complex arrays. Let’s look at an example:
Line 1 imports the Pandas library. Line 2 creates a complex matrix where the first column is the index of labels and the 2nd column is the actual data. It looks like this:
eggs
30
apples
6
milk
Yes
bread
No
dtype: object
If you “print groceries[‘eggs’]”. The result is: 30.
Pandas allows you to perform mathematics on values in a matrix:
print(groceries / 2) =
eggs
15
apples
3
milk
Yes
bread
No
You can also create a more complex matrix by creating a dictionary of Pandas series:
You can also create a Python dictionary and then create a Panda dataframe from the dictionary along with indexes. See the following:
#Create a list of Python dictionaries items2 = [{‘bikes’: 21, ‘pants’: 36, ‘watches’: 40}, {‘watches’: 12, ‘glasses’: 51, ‘bikes’: 18, ‘pants’:9}]
#Create a Panda DataFrame store_items = pd.DataFrame(items2, index=[‘store 1’, ‘store 2’])
#Display the DataFrame store_items
It displays as:
bikes
pants
watches
glasses
store 1
20
30
35
NaN
store 2
15
5
10
50.0
To add a column:
store_items[‘shirts’] = [15,2]
Now, the DataFrame displays:
bikes
pants
watches
glasses
shirts
store 1
20
30
35
NaN
15
store 2
15
5
10
50.0
2
Anaconda and Jupyter Notebooks
Now that I have covered a bit of NumPy and Pandas for manipulating data arrays, let’s delve a bit into a Python platform called Anaconda. Anaconda is a “navigator” that allows users to download any and all libraries available for the Python platform. These libraries include mathematical libraries, different types of Python compilers, artificial intelligence libraries (like PyTorch) and the Jupyter Notebook which is a web-based user interface for displaying comments and typing in Python code that runs on command. It’s a tool not necessarily to write production-level Python code, but more a tool to train and test out python code while displaying well-formatted comments.
Below is an example of a Jupyter webpage (or notebook) that includes a comments section with images and then a subsequent code section. This Jupyter notebook talks about Python tensors and Pytorch, the essentials for artificial intelligence.
Neural Networks
Neural networks have been around for a while. The basically emulate the way our brains work. The networks are built from individual parts approximating neurons which are interconnected and are the basis for how the brain learns.
“Digital” neurons are no different. They are interconnected in such a way that over time they learn and are able to apply the learned knowledge to enable useful applications such as natural language (like Alexa) and image identification (like Google Lens). It really is amazing how well it works, and the progress over the past five years alone has been remarkable. I’ll talk more about that later.
So how does it work exactly? Let’s take the example of identifying text in an image; specifically, digits 0 to 9. Just 5 years ago, this was a very complicated problem. Today, it’s a trivial one. The image below displays greyscale handwritten digits where each image is 28×28 pixels.
Greyscale handwritten digits
The first step is to train the software or the “network” in AI lingo. This means feeding it 100s if not 1000s of sample 28×28 pixel images of digits and tagging those images with the actual numbers so the software learns what number the image represents exactly. Luckily, Pytorch includes lots of tagged training data called MNIST. This data can be used to train the network so when you present your own image of a digit, it will correctly interpret what it is.
Single digit
The above image is an example of a greyscale “8” that is 28 x 28 pixels. This is the type of image that would be fed into the network to train it that this type of image is an “8”.
Neural Networks
The above images shows a simple neural network. The far left-hand side displays the inputs (x1 and x2). In our example, the inputs would be the color of each of the 28 x 28 pixels. The values (w1 and w2) are called “weights” These weights are multiplied by each of the corresponding inputs (i.e. – dot product of two vectors) and then inputted into a function that creates an output value (0 to 9) that is compared to the actual value assigned to the image. For example, in the digit training image above (the number “8”), the tag assigned to this image is 8. Therefore, the calculated output is compared to the tagged value. If it matches, then we’ve trained it well for that particular test image and the weights will be reused. If not, then we need to go back and adjust the weights to create a new output value. This back and forth can occur 1000s of times until the correct formula is found.
ASHRAE’s Building EQ Web Portal provides a quick energy analysis that benchmarks a building’s energy performance. Building EQ assists in the preparation of an ASHRAE Level 1 Energy Audit to identify means to improve a building’s energy performance including low-cost, no-cost energy efficiency measures and an Indoor Environmental Quality (IEQ) survey with recorded measurements to provide additional information to assess a building’s performance.
Two different evaluations can be used independently to compare a candidate building to other similar buildings in the same climate zone or together for an assessment of a building’s design potential compared to actual operation:
In Operation compares actual building energy use based on metered energy information.
As Designed compares potential energy use based on the building’s physical characteristics and systems with standardized energy use simulation.
The Old Way
When Building EQ was first introduced, building owners and engineers could submit information about their candidate building to ASHRAE using an Excel spreadsheet template. This was a very inefficient way of doing things. It involved filling out the required data into a spreadsheet, and then uploading the spreadsheet(s) to the ASHRAE Building EQ website. Then, ASHRAE personnel would open the spreadsheet and determine whether the data was valid, and if it was, what rating to assign the building. The spreadsheet method was wrought with many inefficiencies including:
If data was missing or invalid, the spreadsheet would be sent back to the building owner to be corrected. This involved working with multiple versions of the spreadsheet which could very quickly become confusing and could potentially result in working with outdated and incorrect data.
ASHRAE personnel would validate all of the data manually, which was a slow and inaccurate process.
There were no links within the spreadsheet to ENERGY STAR Portfolio Manager that would allow users to migrate data to/from other programs into bEQ.
The spreadsheet was only in IP units.
Many more inefficiencies too numerous to list here
The New Web Portal
In 2016, Carmel Software was hired to develop the web-based user interface that would solve all of the problems above and introduce even more efficiencies and features that a spreadsheet could never provide. In addition, Carmel has tasked to develop a website that would be able to accommodate many types of connected devices including Windows and Mac desktops/laptops, all iOS and Android mobile smartphones and tablets. After about 9 months of development, the ASHRAE Building EQ portal was officially launched, and it has been a resounding success. More project submissions were made within the first 2 months of the website launch than within the first 5 years of existence of the Building EQ rating system with only spreadsheet submissions. As of November 2019, over 500 projects have been submitted.
What Does Building EQ Measure?
The Building EQ rating system rates building energy usage only. It is not meant to compete with LEED which measures far more including water usage, material sourcing, and much more. The Building EQ rating system works as follows:
Based upon the building type, climate zone, and heating and cooling degree days, a lookup for a benchmark value is performed using an ASHRAE Standard 100 site median table derived from CBECS (Commercial Building Energy Consumption Survey) 2012 building energy usage data. This usage data is expressed in units of energy use intensity (EUI) which is the amount of energy used per square foot per year.
The user then enters a year’s worth of utility data and the total square footage of the building to calculate the specific building’s EUI. This building-specific EUI is compared with the normalized benchmark EUI and a Building EQ score is derived by dividing the two numbers then multiplying by 100. The range of the score is from 0 to 200 where 0 is the most energy efficient and 200 is the least. A score below 100 is considered energy efficient since the specific building beats the benchmark EUI derived from CBECS.
Additional Inputs
There are many additional inputs in the ASHRAE Building EQ web portal above and beyond those that are used to calculate the Building EQ score. Below is a list of these additional inputs for the In Operation method:
Building Performance Credentials
The “Building Performance Credentials” section allows the user to input any other ratings or scores the building may have received including Energy Star, LEED, Green Globes, and more.
IEQ Screening
The “Indoor Environmental Quality Screening” tab includes a number of accordions (sections) that allow the user to input additional information about the building.
The objective of the building indoor environmental quality (IEQ) screening is to verify that the IEQ of the building as it affects the occupants has not been obviously compromised in the pursuit of energy efficiency and energy savings. The screening is intended to go beyond professional judgment with the inclusion of actual measurements. The measurements are focused on areas identified in the screening and are therefore representative of the building spaces and not intended to be all inclusive. If no issues are identified, the Assessor should take representative spot measurements throughout the building in order to provide feedback to the building owner/operator. Representative space types may be determined by space type (office, conference room, corridor), by space usage (different tenants or floors), or by space system type (building served by multiple system types). The information is provided to the building operator for follow-up actions and to benchmark, evaluate, and diagnosis building systems that affect indoor environmental quality including thermal comfort, lighting quality, and ventilation for indoor air quality. The IEQ screening is not intended to serve in the place of a full IEQ evaluation performed by an expert in that field. For this reason, it is important that the building owner follow up separately on any deficiency or potential problem noted on the forms by having a full IEQ evaluation performed by a qualified professional.
Energy Efficiency Measures (EEMs)
This tab allows the user to input any energy efficiency or conservation measures that have been implemented. The measures are divided by category: Building Envelope, Lighting, HVAC, Refrigeration, Energy Generation/Distribution, Other). Within each accordion is a drop down with a list of pre-populated measures. These measures are outlined in Informative Annex D and Informative Annex E of ASHRAE Standard 100-2015. The measures are divided by category: Building Envelope, Lighting, HVAC, Refrigeration, Energy Generation/Distribution, Other).
The user is also able to enter a cost range and payback period for each measure.
There are 3 additional inputs in each accordion that allow the user to input their own custom measure descriptions along with cost ranges and payback periods.
Photos and Attachments
This final tab allows users to add photos and attachments along with descriptions and categories. These photos will appear in the narrative report.
Building EQ Reporting
Standard 211 Audit Spreadsheet
Building EQ does something else that no other rating system does: It works closely with ASHRAE Standard 211 – Standard for Commercial Building Energy Audits. This is an ANSI standard that formalizes the process of performing building energy audits. ASHRAE Standard 211 protects a building owner/operator’s energy audit investment by providing an outline for auditors and offering best practices that ensure quality audits. It sets forth requirements for the experience and credentials of energy auditors, specifications for compliance and clear definitions of the audit processes and scope.
A Standard 211 audit spreadsheet is included along with the actual text of the standard. This spreadsheet allows users to fill in all information related to Level 1 and Level 2 energy audits.
Remember, the primary function of an energy audit is to identify all of the energy streams in a facility in order to balance total energy input with energy use. The ASHRAE Level 1 is a simple and quick audit that requires a brief review of building operating characteristics. It mainly identifies low-cost/no-cost measures and will only uncover major problem areas. Level 1 audits are a great way to prioritize energy efficiency projects and to assess the need for a more detailed audit. The ASHRAE Level 2 audit includes the Level 1 audit plus more detailed energy calculations and life cycle cost analysis of proposed energy efficiency measures. This type of audit identifies all energy conservation measures appropriate for the facility given its operating parameters.
Much of the information required to fill out the Level 1 inputs in the audit spreadsheet are already inputted into the ASHRAE Building EQ web portal. Therefore, the portal allows the user (for a fee) to create a Standard 211 spreadsheet with many of the Level 1 inputs pre-populated. Even though the spreadsheet also includes Level 2 parameters, Building EQ does not include most of the information required for Level 2 audits. Therefore, this information needs to be manually filled in.
Below is a screenshot of one of the tabs in the Standard 211 Excel spreadsheet:
ASHRAE Building EQ Label
Once a Building EQ project is approved by ASHRAE personnel, the user is able to print out a Building EQ label that includes the Building EQ logo along with a sliding scale showing the final Building EQ score. The following is an example of the Building EQ label:
Building EQ Energy Audit Narrative Report
This Microsoft Word doc report provides a template for an ASHRAE Level 1 Energy Audit that follows the information in Section 6 (Reporting), Annex C (Reporting Forms), and Annex D (Report Outlines) in ASHRAE Standard 211. The template provides recommended text and boiler plate language to assist the user in preparing a comprehensive report and is automatically populated with information collected and entered into the Building EQ Portal as part of the Building EQ In Operation assessment process. The recommended text can be edited as needed by the user. The audit specific information populated from the Building EQ Portal is shown in filled-in tables in the report. Below is an example of two pages of the report:
Additional Functionality
The Building EQ portal includes additional functionality that helps expand its usefulness:
Integration with Energy Star EUI Data
Depending upon the building type that the user selects, the energy utilization index (EUI) data will either be pulled from ASHRAE Standard 100 database in Building EQ or from an Energy Star service hosted by Architecture 2030 Zero-Tool. Each Energy Star building type has a different set of parameters associated with it so the user will be prompted to input many different types of values. Once the user has inputted all of the required information, pressing the “Get EUI Values” button calls a remote calculation engine that retrieves the appropriate Energy Star EUI value based upon the building type and parameter inputs.
Integration with Energy Star Portfolio Manager
For electricity, natural gas, and other “non-delivered” fuel types, the user can import utility data that already exists in Energy Star’s Portfolio Manager software. All the user needs to do is export the utility data from a PM project to a .csv file. Then, import the .csv file into the appropriate fuel type. The data should be monthly for one year taken within the past 18 months.
Integration with BuildingSync
BuildingSync® is a common schema for energy audit data that can be utilized by different software and databases involved in the energy audit process. It allows data to be more easily aggregated, compared, and exchanged between different databases and software tools. This streamlines the energy audit process, improving the value of the data, minimizing duplication of effort for subsequent audits, and facilitating achievement of greater energy efficiency.
Several tools utilize BuildingSync including U.S. Department of Energy’s Building Energy Asset Score. Asset Score is a national standardized tool for assessing the physical and structural energy efficiency of commercial and multifamily residential buildings. The Asset Score generates a simple energy efficiency rating that enables comparison among buildings, and identifies opportunities to invest in energy efficiency upgrades. Data exported from Asset Score (specifically Audit Template) via BuildingSync can be imported into BuildingEQ to populate relevant (but not all) data.
Latest Stats
The following are the latest stats as of December 1, 2019:
Carmel Software has been developing mobile apps for 10 years. In fact, we were the first to release HVAC-specific mobile apps for Apple iOS, and we currently have 200,000+ apps downloaded by users world-wide.
What makes mobile apps so different from desktop apps is the ability for small companies like ours to reach tens of thousands of users world-wide. Downloading an app from your smartphone is so easy, simple, and inexpensive, that it enables a company like ours to reach out to so many more users compared to our desktop software.
Another amazing thing about mobile apps is the ability to anonymously (and I stress ANONYMOUSLY) track where and how users actually user our apps out in the field. This provides incredibly valuable feedback to us regarding how our apps are actually used in real time. Let’s look at some examples below.
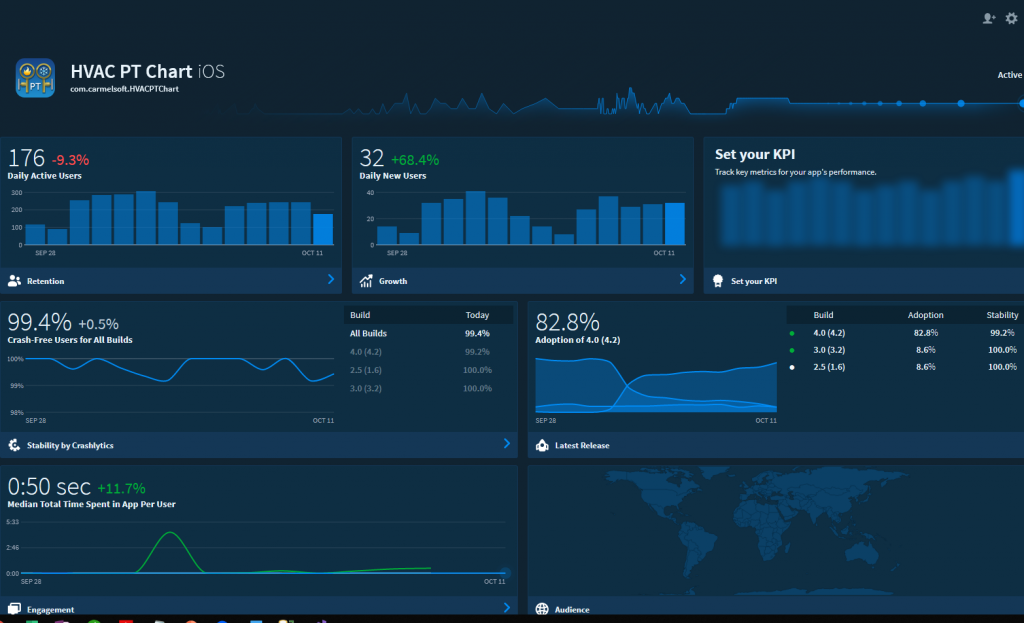
HVAC PT Chart
The HVAC PT Chart app is a free iOS app that allows HVAC technicians to quickly perform pressure-temperature lookups for over 100 different types of refrigerants. As a technician is measuring refrigerant pressure or temperature using the pressure-temperature gauge, they can use our app to confirm that the pressure-temperature combinations are correct. Because this app is free, the number of downloads is exponentially greater than even our $0.99 apps. Free really does sell.
Tens of thousands of technicians have downloaded this app, so it really helps create critical mass in terms of tracking how this app is used and how and where technicians work.
The image above captures a snapshot of how many users have used the PT Chart app on a typical Friday by late morning. This dashboard also captures other interesting information including:
User locations
How long users have used the app (interestingly, most users use this app for less than 1 minute at a time)
Whether the app has crashed or not
What version of the app users are using
What parts and features of the app are users taking advantage of
The image below shows geographical usage since the beginning of the year. As you can see, the app is pretty much used world-wide (the light and dark blue signifies countries using the app). The dark blue areas indicate the highest concentration of users.
Another screen shows the following additional information:
The left-hand side shows what percentage of users are using the app on iPhones versus iPads. The right-hand side shows what percentage of users are using the app on different iOS versions.
Now, there question is: Is any of this data useful and actionable?
We can see that the majority of users use the app on the iPhone, so this tells us to concentrate most of our efforts on improving the iPhone interface. Also, knowing that 100s of HVAC technicians use this app each day tells us that this app is quite useful and a good candidate for some in-app advertising (more on this in a future blog post).
Also, it’s quite useful to know that users use this app for less than 1 minute on average. This allows us to better tailor certain features to accommodate speedy usage of the app. For example, immediately when users open the app, they are able to select a refrigerant type, select the temperature or pressure and observe the corresponding values.
HVAC Equipment Locator
The HVAC Equipment Locator is a mobile application for Apple iOS and Android that lets users track, share, and customize HVAC equipment nameplate and maintenance data:
TRACK all equipment location, nameplate, and maintenance data along with photos and spec sheets.
SHARE all of this data with other authorized users.
CUSTOMIZE the app input screens so users can store and view the exact data about building, equipment, or maintenance events. All equipment data and user access using the Equipment Locator Cloud website.
The following is an interactive Google map that plots a subset (1000s) of all of the approximate locations of HVAC equipment that are currently being tracked and serviced by the HVAC Equipment Locator app:
Not only are we tracking usage of the Locator app, itself, but also tracking the GPS coordinates of all of the equipment that users are storing in the cloud. Once we receive enough equipment information, we can start to see trends of where different makes and models of equipment are geographically located, and also what types and where HVAC maintenance is being performed.
Carmel Software was hired by the National Renewable Energy Lab (NREL) to update and improve the Green Building XML (http://www.gbXML.org) schema, all in the name of improving interoperability amongst disparate building design software tools. This progress report summarizes the work completed over the past year.
Overall Goal and Objectives
The goal of this project was to validate the National Renewable Energy Lab’s (NREL’s) OpenStudio software tool to produce valid gbXML and also set the stage to validate other BIM and building analysis software tools in the future. There were three main objectives of this validation work.
The first objective was to demonstrate that the OpenStudio software could pass the gbXML validation procedure.
The second objective was to encourage other software vendors to certify their software using the validation procedure as well.
The third objective was to work towards a generic validator that could be used on general user models, as opposed to the strict test case models required by the gbXML validation procedure. Delivering a fully working validator was out of scope of this work, therefore requirements were developed to set the stage for future work.
In support of the first objective, we developed OpenStudio models which represented the buildings in the validation procedure test case. These models were generated programmatically using the OpenStudio Ruby Application Programming Interface (API) to reduce maintenance costs and to allow them to be leveraged for other purposes. OpenStudio passed the validation procedures and is now the first software authoring tool to officially become “gbXML certified” (http://gbxml.org/OpenStudioCertification_Latest ).
In support of the second objective, we drastically improved the validation website, documentation, and tools required to apply the validation procedure. We publicized the validation procedure and encouraged gbXML software vendors to apply it to their tools. This required contacting other gbXML software vendors directly as well as making public announcements, conducting live webinars, and promoting other ways to generate user interest in the validation efforts. We publicized the state of the OpenStudio validation efforts to encourage other software tools to apply the validation procedure to their own tools. In addition, we simplified and streamlined the validation process to allow the process to be both more responsive and clear to market demands, while also allowing room for future growth of test cases. In fact, Autodesk will soon be validated to Level 2 compliance (see below) and is working with gbXML.org on Level 3 compliance.
In support of the third objective, we developed requirements for a generic validator. User stories were developed and preliminary mockups were made. The most important user story developed was to allow a user to upload their gbXML file to the gbXML.org website and view a 3D representation in their web browser. This would allow the user to identify any problems with their model visually. The second use case was for software to detect certain classes of problems with the user’s model and identify those visually in the 3D display. Finally, the use case of upgrading user models to the current gbXML schema version was identified.
Tasks
Here are the tasks that were performed to achieve the above objectives:
Developed OpenStudio Models for Validation Procedure
We developed OpenStudio models for a number of the buildings in the validation procedure test suite. The test cases were derived from the ASHRAE RP-1468 documentation. The models were programmatically generated using the OpenStudio Ruby API. All scripts and model content developed for this purpose were developed under the Lesser General Public License (LGPL) open source license and are maintained in a public repository on github.com (https://github.com/GreenBuildingXML/openstudio-gbxml-validation ).
Validated OpenStudio gbXML Export/Import
We applied validation procedures to each of the OpenStudio models developed in task 1. We verified that each of the validation test cases imported correctly into the OpenStudio SketchUp plug-in. We also addressed any issues with the validation software that were found in this work. For example, the OpenStudio validation forced gbXML.org to address geometry created by thin-walled geometries, and metric-only software. Previous versions of the validator only addressed thick-walled geometry engines, and supported IP-units. The validation process and OpenStudio were made more robust as a result of this process.
Highlights of improvements/fixes to OpenStudio as a result of this project:
• correctly specifies SlabOnGrade elements
• correctly handles area calculations of sloping floors and ceilings (before calculated area as zero)
• handles most second-level space boundary translations, automatically, for simple geometries
• gbXML export up-to-date with version 6.01 of gbXML
Highlights of improvements/fixes to gbXML validation as a result of this process:
• unit of measure handling
• special procedure development for thin-walled geometry creators, opening up validation to a wider audience
• improved validation website user interface and user experience
• better error-handling and user messaging when validation fails
• improved geometry validation engine
Improved Validation Website and Documentation
The previous validation website was not hosted on the gbxml.org domain which reduced its visibility and credibility. For this task, we moved the gbxml.org website to a hosting platform that supports the validator software. The gbxml.org website was redesigned to more prominently display the validation procedure and documentation. The website now shows which software tools have been validated or are in the process of being validated. See http://www.gbxml.org for more details.
Promoted gbXML Validation Efforts
This task was performed in parallel with other tasks listed above; the purpose was to keep other software vendors and the public up to date on gbXML validation efforts. We attended the four day SimBuild 2016 Conference in Salt Lake City in August 2016 to promote gbXML validation efforts. In addition, we conducted two live webinars to explain our work.
Generic Validator
Delivering a fully functional generic validator was out of scope for this work. Therefore, work on this area was focused on developing user stories and requirements for future work. The most important user story developed was to allow a user to upload their gbXML file to the gbXML.org website and view a 3D representation in their web browser. This would allow the user to identify any problems with their model visually. The second use case was for software to detect certain classes of problems with the user’s model and identify those visually in the 3D display. Finally, the use case of upgrading user models to the current gbXML schema version was identified.
Integration with the Autodesk Forge API was investigated as a potential solution for viewing user submitted 3D models. However, this is still a work-in-progress since the Forge API is in beta phase.
Significant Findings and Issues
During this project, we decided that 3 levels of gbXML certification, or compliance, were required to provide more clarity to the community of users and vendors.:
Level 1 compliance involves validating that a gbXML file is a well formed XML (per the W3C ISO Standard) and also conforms to the gbXML XSD (from gbXML versions 0.37 to 6.01, depending upon which version the software tool currently exports).
Level 2 compliance involves validating a gbXML file against 8 to 10 geometric “test-cases” that are based upon ASHRAE Research Project 1468, “Development of a Reference Building Information Model (BIM) for Thermal Model Compliance Testing”. Level 2 requires that second level space boundaries be correct for the simplest test cases, and pass a small subset of translation edge cases.
Level 3 compliance has yet to be fully defined. However, Level 3 does involve certain levels of vendor tool automation that goes far above and beyond Levels 1 and 2 compliance. We are currently working with Autodesk to better define Level 3 compliance (See the Future Work section for more details).
List of Issues
OpenStudio passed the following test cases:
Test Case 3: Test for proper second level space boundary representation
Test Case 6: Test for proper second level space boundary representation
Test Case 7: Test for basic pitched roof representation
Test Case 8: Test for basic sloped slab on grade representation
Test Case 12: Test for proper second level space boundary representation
Basic Whole Building Test Case 1: Test for proper second level space boundary representation
To pass these test cases, it did require that NREL make some updates to the OpenStudio SDK responsible for gbXML export since there were a few errors that were pervasive for every test case. Therefore, NREL needed to make some changes to the gbXML export feature of OpenStudio to be compliant with the validation process. gbXML provided NREL with guidance as to how each XML file should look in order to pass, which NREL took and made changes to their code base. In some cases, gbXML decided to relax configurable constraints, to allow the document to pass.
Below is the full list of issues and changes to the OpenStudio code base made as a result of this work effort:
There were no BuildingStorey definitions in any export from OpenStudio. This is a required element, but we relaxed this for validation purposes.
The Building->Area calculation that was done during export did not meet gbXML specifications for the Building Area calculation. To be fair, gbXML may not have the tightest definition in terms of the criteria for when a Space Area is included in the Building Area, but the point is, plenums and other non-occupiable spaces shouldn’t be included in the building area calculation.
Any time there was a floor that was on-grade (industry standard is when z=0, and it seems OpenStudio follows this convention) we would expect the surfaceTypeEnum for that surface to be SlabOnGrade, but OpenStudio defines these surfaces as UndergroundFloor. This needed to be changed.
Thin-Shelled geometry challenges: The fact that OpenStudio makes gbXML derived from a thin-walled geometry paradigm consistent with the building energy modeling paradigm as opposed to a BIM model posed a basic philosophical challenge for the validation process. Originally, the validator was designed for BIM-centric tools that have wall thicknesses inherent in the modeling environment. Autodesk Revit, for example, assumes that the wall thicknesses affect the volume and area calculations, even though the wall vertices go to the centerline of the thickness (as if the walls had no thickness at all). When we tried to use these same standard test files as a comparison point for a gbXML created via OpenStudio, we encountered an issue. Whereas we modeled the walls in OpenStudio as if they were on the centerline, with the same coordinates as the standard files, now the volume and area calculations came out differently than the standard files. Of course, if we tried changing things around and modeled the surfaces in OpenStudio at the inner wetted perimeter, we get the volume and area correct, but now the polygon coordinates are in a different location and don’t match the standard file PolyLoop coordinates. So either way, it is not a perfect process.
Changes to the validator code base: We made several improvements to the validation engine itself, and also to the standard test case XML files as a result of this work that has already been incorporated into the latest version of the validator. We found two problems with the standard test case files: Occasionally, there were still errors in the files that should no longer persist by the end of this process. The whole building test cases, made at the end of phase two, were particularly problematic because we made them with Honeybee out of Grasshopper. Secondly, sometimes the decimal precision was pretty extreme because for all the other test cases we used Revit in US-IP units to create the test cases originally. This meant for sloping surfaces, there was sometimes units like 9’10-11/16” that made for some difficulties when re-creating the test cases. We tightened these up so for a majority of the test cases there was much less guess-work and complexities around the units of measure.
Future Work – New gbXML Features
Further Develop Level 3 Compliance
We will be working with Autodesk to achieve Level 3 certification, which has yet to be fully defined. It does involve certain levels of vendor tool automation that goes far above and beyond Levels 1 and 2 compliance. Autodesk desires to achieve Level 3 compliance for both Autodesk Revit and Insight 360. Some examples of Autodesk-specific Level 3 automation include:
Handling ‘real’ architectural models i.e. supporting a very wide variety of modeling practices, coping with natural inaccuracies (small gaps / overlaps) and scaling from concept to detailed design
Automatic perimeter / core thermal zoning
Automatic identification of elements acting as shading (as opposed to room bounding) without manual definition
Handling ‘Sandwich’ conditions i.e. when two or more elements are adjacent or very closely adjacent and often not perfectly parallel but essentially a single gbXML surface
Definition of material thermal properties (which get very interesting when combined with sandwich conditions)
Working with or with explicit room/space objects and their associate metadata
Above / below grade
Columns
Openings
Ceiling voids
Discuss the possibility of “use case” based validation. For example, what fields are required for the energy modeling use case (or maybe the OpenStudio use case)? What fields are required for the HVAC loads use case? See http://www.hpxmlonline.com/tools-resources/data-selection-tool/ for an example of this.
Develop a gbXML Conversion Tool
Both NREL and Autodesk have requested that we develop a simple software tool (web-based) that converts previous versions of gbXML (i.e. – 0.37) to later or the current versions since major tools such as Autodesk Revit continue to support the 0.37 version while validation only supports the latest version. This is not an easy task on the part of the software vendor to update to the latest version since tools like Autodesk Revit have long-term “wish-list to release cycles” (often 1 or more years). Therefore, developing a conversion tool will allow these previous versions of gbXML to update to later versions.
Develop a Generic Validator and Open-Source Geometry Engine
While we have successfully developed a test-case validation tool (http://gbxml.org/validator/Pages/TestPage.aspx ), we still need to develop a “generic” validation software tool that can be used by more stakeholders including energy modelers, engineers, architects, and others. This tool should be able to validate any generic gbXML, not just test-case gbXML files. We believe we are closer than ever to achieving this vision, however, there is limited time and budget to test such concepts. Developing unit tests, and making incremental improvements to this code base, is a full-time effort that is constantly in need of development efforts.
The software development effort taken thus far to develop vendor certification tools will be leveraged for the generic validator, one that can accept any user model. A web page shall be developed on gbXML.org so a user can upload their gbXML model and the validator shall determine if there are any defects. If there are defects, the website shall provide information to alert the user to any defects that were found. A web based 3D visualization tool may be provided to visualize the uploaded model and to identify the defects in a meaningful way. We plan on using Autodesk’s Forge Viewer API to translate the gbXML geometry into a web-based model.
Create a gbXML Portal and Accompanying Web Service
Along with the generic validator wish-list item above, another long-time goal has been to create a gbXML “portal” that allows users to register and upload gbXML files for remote storage. We would create a web service (or web API) that could be accessed by authorized software tools to import and/or export gbXML files to and from this portal. This would provide the following benefits:
Different “dot” versions of gbXML could automatically be converted to the appropriate “dot” gbXML version that is supported by a consuming software tool.
Different versions of the same gbXML file that is produced by a BIM authoring tool could be stored in the portal so that a consuming tool could easily re-import it and update any changed information. Think of it as a sort of “version control” function.
If enough gbXML files are uploaded to the portal, we could begin to analyze the data and look for trends that may benefit the industry. For example, information from the uploaded models could be analyzed so as to gain insight on the use of gbXML in practice, e.g. which software tool authored the model and which defects were found.
I recently hosted an ASHRAE-sponsored webinar that discussed the basics of psychrometrics and also included a demo of the ASHRAE Psychrometric Chart iPad app (which we designed). I was amazed that almost 900 people registered for this webinar. This tells me that there is keen interest in understanding psychrometrics and also finding ways to more easily perform psychrometric calculations.
The following are links to both the webinar recording and a PDF of the PowerPoint slide deck:
Click here to download a PDF of the PowerPoint slide deck.
This webinar included an overview of the science behind psychrometrics. Then, I demo’d the app by creating sample HVAC processes. This webinar could have easily gone on for two hours, but I was limited to one. I will split this topic into 2 separate blog postings. This month’s posting will talk about the basics of psychrometrics. A follow-up blog posting will show 10 example HVAC processes using the psych chart app.
Importance of Psychrometrics
The study and understanding of psychrometrics is so important for helping engineers to design HVAC systems for all types of applications and situations including:
It’s vital for human comfort since it’s difficult to work when the conditions are too humid or too dry. The following slide displays the comfort zone for humans:
2. HVAC systems designed for controlling the environment (temperature, humidity and pollutants) within a museum, a library, or any type of archival facility is much more complex than the system designed simply for maintaining human comfort. This system is designed to control the environment for the preservation of highly valuable artifacts or works of art. These HVAC systems must be operational 24/7 and often require redundancy.
3. Hospital ORs are kept so cold that there is always risk of condensation from the ceiling since the temperature often goes below the dew point of ambient conditions (it’s called “raining in the OR”). Therefore, using psychrometrics, it’s possible to determine the proper humidity ratio of the air so as to eliminate condensation.
4. Many industrial and manufacturing companies use chilled water to remove heat from various manufacturing processes. As the air or process is cooled below the ambient dew point, condensation can occur. Desiccant dehumidifiers can eliminate this condensation. This results in a higher quality part and reduced cycle time, allowing manufactured parts to be produced faster.
Is it Art or is it Science?
If you take the equations from the ASHRAE Handbook of Fundamentals seen below and create a visual representation of those equations, it becomes a powerful tool for HVAC design.
You create this visually appealing chart that allows you to plot simple and complex HVAC processes and actually visualize
them. Even those outside the industry can begin to understand what the ratios of air to water mean and how HVAC systems alter those ratios for the benefit of human comfort.
Definition of Psychrometrics
A psychrometric chart is a graph of the thermodynamic parameters of moist air at a constant elevation or barometric pressure. The genius behind this chart is that it allows HVAC professionals to visualize all types of HVAC processes for cooling, heating, humidification, dehumidification and much more.
Here’s a chart at 0 feet elevation:
Here’s a chart at 12,000 feet elevation. It looks a bit different than the 0 elevation chart:
Before psychrometric software for desktop or mobile, most engineers had to resort to using the 0 elevation chart even if they were designing a building in, say, Denver which is 5000 ft elevation. This produces inaccurate results because the density of air is so different between 0 and 5000 feet. As you can see, the elevation change drastically changes the shape of the graph.
The Components of the Psychrometric Chart
The following is a list of the components that make up a psychrometric chart:
Dry bulb temperature: The temperature of air as registered by an ordinary thermometer
Absolute humidity or moisture content: The weight of water vapor in grains or pounds of moisture per pound of dry air or grams of water vapor per kg of air, i.e. g/kg. It is also known as moisture content or humidity ratio.
Wet bulb temperature: The temperature registered by a thermometer whose bulb is covered by a wetted wick and exposed to a current of rapidly moving air (sling psychrometer)
Enthalpy: A thermal property indicating the quantity of heat in the air above an arbitrary datum, in Btu per pound of dry air. The datum for dry air is 0 deg F and, for the moisture content 32 deg F water.
Specific volume: The cubic feet of the mixture per pound of dry air or cubic meter of the mixture per kg of dry air represented in m3/kg. It is the reciprocal of density. (1 over the density)
Relative humidity: RH is an expression of the moisture content of a given atmosphere as a percentage of the saturation humidity at the same temperature. Most everyone uses this # to communicate how humid it is out: 50% humidity.
Dew point temperature: The temperature at which condensation of moisture begins when the air is cooled. The best example of this is a cold glass of water. If the temp. of the water is less than the dewpoint of the ambient conditions, then you will see condensation on the outside of the glass.
SHR protractor: Allows the user to draw the SHR line which is discussed later.
Other Psychrometric Terms
Saturation curve: This is where the air is 100% saturated no matter what the DB and WB temperatures are. Along this curve, the DB, WB, and DP are all the same at any 1 point.
ADP: Apparatus dew point (ADP) is the coil surface dew point temperature required to accomplish a cooling/dehumidifying process. As you can see from this simple psych drawing, the air entering the coil is cooled to slightly less than 100% saturation. If you want to extract water out of the air (dehumidify), then you need to approach the ADP which does
exactly that.
Bypass factor: Some of the air flowing through the coil impinges on the water tubes or the fins and is cooled to the ADP. Other air passes through unchanged.
SHR: The ratio of space sensible cooling to total cooling is useful for plotting the slope of the path that supply air travels after
introduction into the space.
Adiabatic cooling: This is also called evaporative cooling or constant-enthalpy cooling. Adiabatic cooling is the process of reducing heat through a change in air pressure caused by volume expansion. It’s also called free cooling since the sensible heat is being converted to latent heat without the help of mechanical DX cooling.
Simple Psychrometric Processes
Sensible heating/cooling involves the increase or decrease in the temperature of air without changing its humidity ratio. Example: passing moist air over a room space heater.
Humidification/dehumidification involves the increase or decrease in the humidity ratio of air without changing its dry bulb temperature.
Heating and humidifying involves the simultaneous increase in both the dry bulb temperature and humidity ratio of the air.
Cooling and dehumidifying involves the removal of water from the air as the air temperature falls below the dew-point temperature.
Evaporative cooling involves the cooling of air without heat loss or gain. Sensible heat lost by the air is converted to latent heat in the added water vapor. Also called “Free cooling”.
Chemical dehumidification or adiabatic dehumidification is accomplished by passing air through a chemical absorbent like silica gel. Some of the moisture is removed and the latent heat of evaporation is released. There will be an increase in sensible heat
content and along the enthalpy line.
Complex Processes
Complex psychrometric process include a combination of the simple processes discussed above. I will touch upon these complex processes in next month’s blog that will include up to 10 examples of complex psychrometric processes.
Click the following image to download the app:
Stay tuned for next month where I will describe 10 psychrometric use cases ranging from simple cooling to complex combo indirect/direct dehumidification and cooling.


 Website")
 Website")
 Website")
 Website")
 Website")
 Website")
 Website")
 Website")
 Website")
 Website")
 Website")
 Website")